top of page
Data & Graphics 📊
Below are projects I've analyzed data and/or created visuals for to tell evidence-backed stories in a creative, intelligible and visually compelling way.

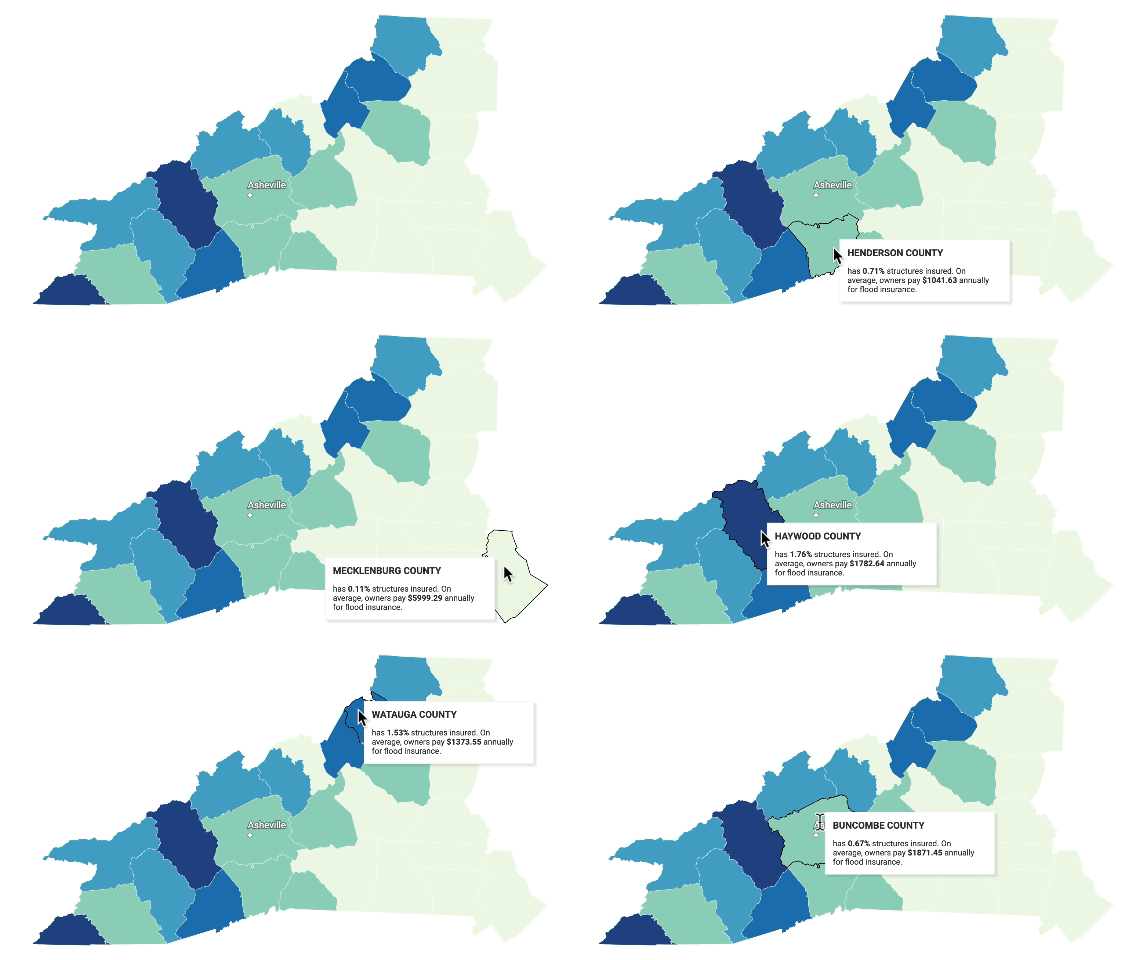
👩🏾🔧 R, Datawrapper, Flourish
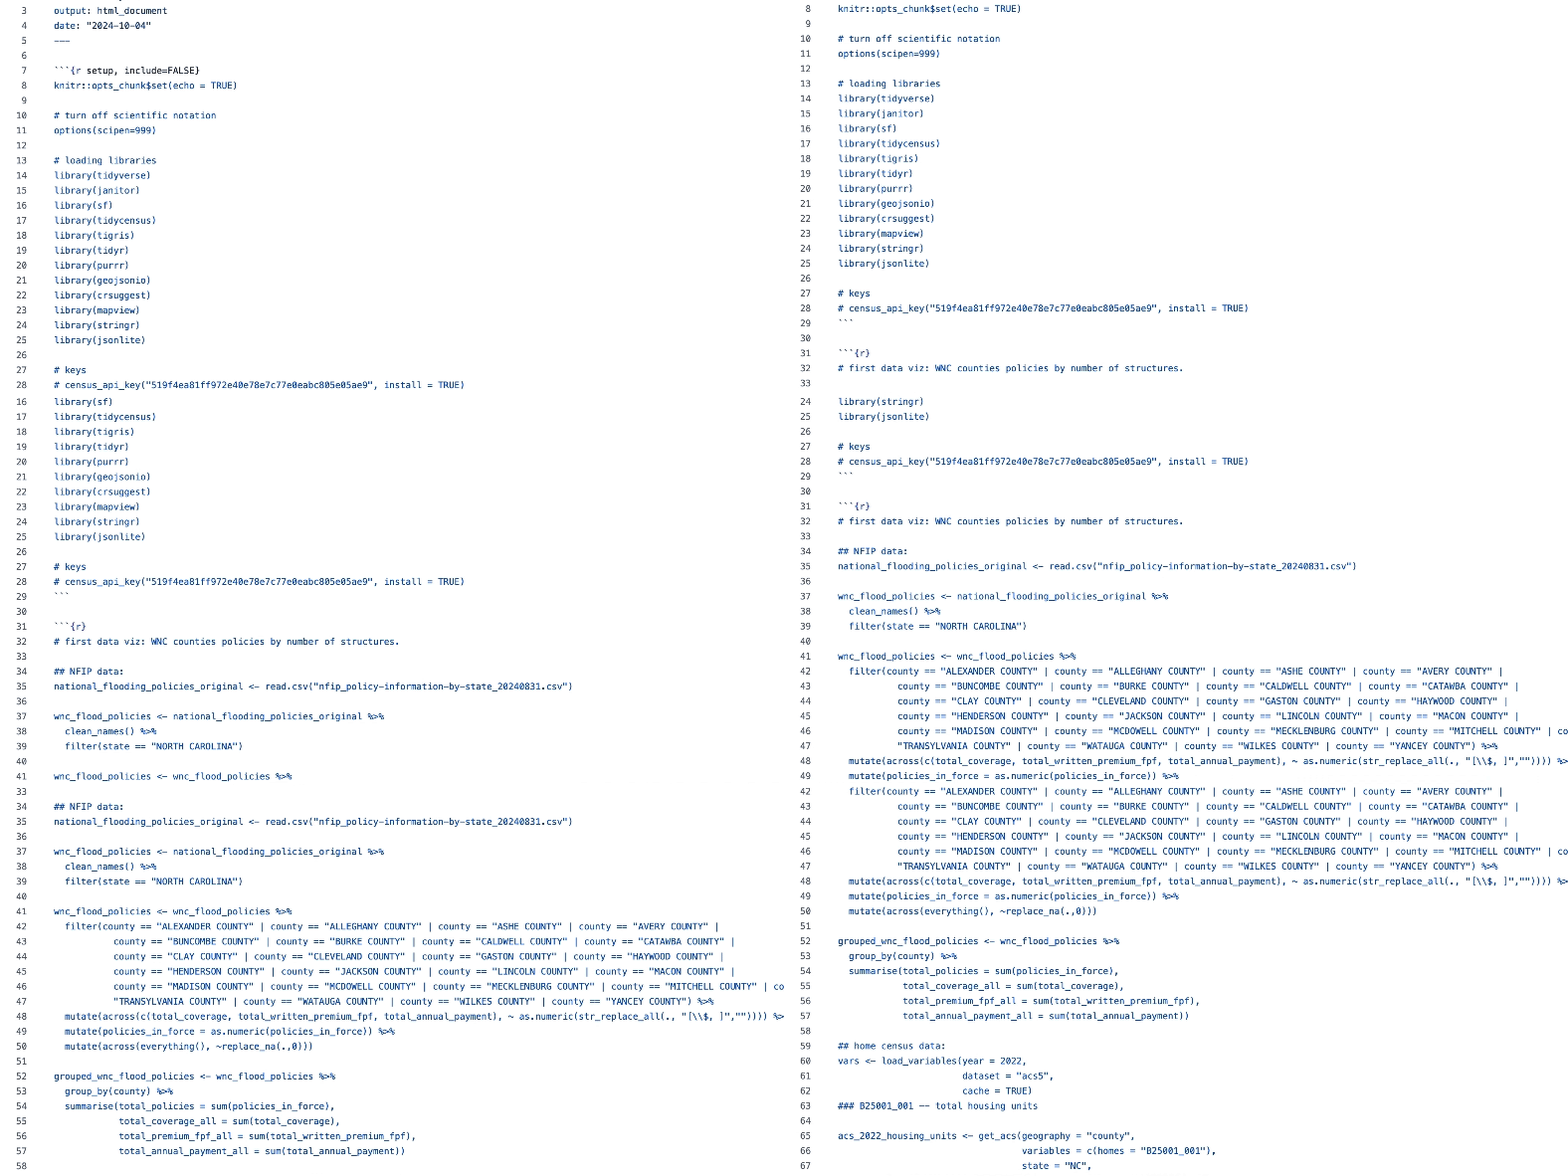
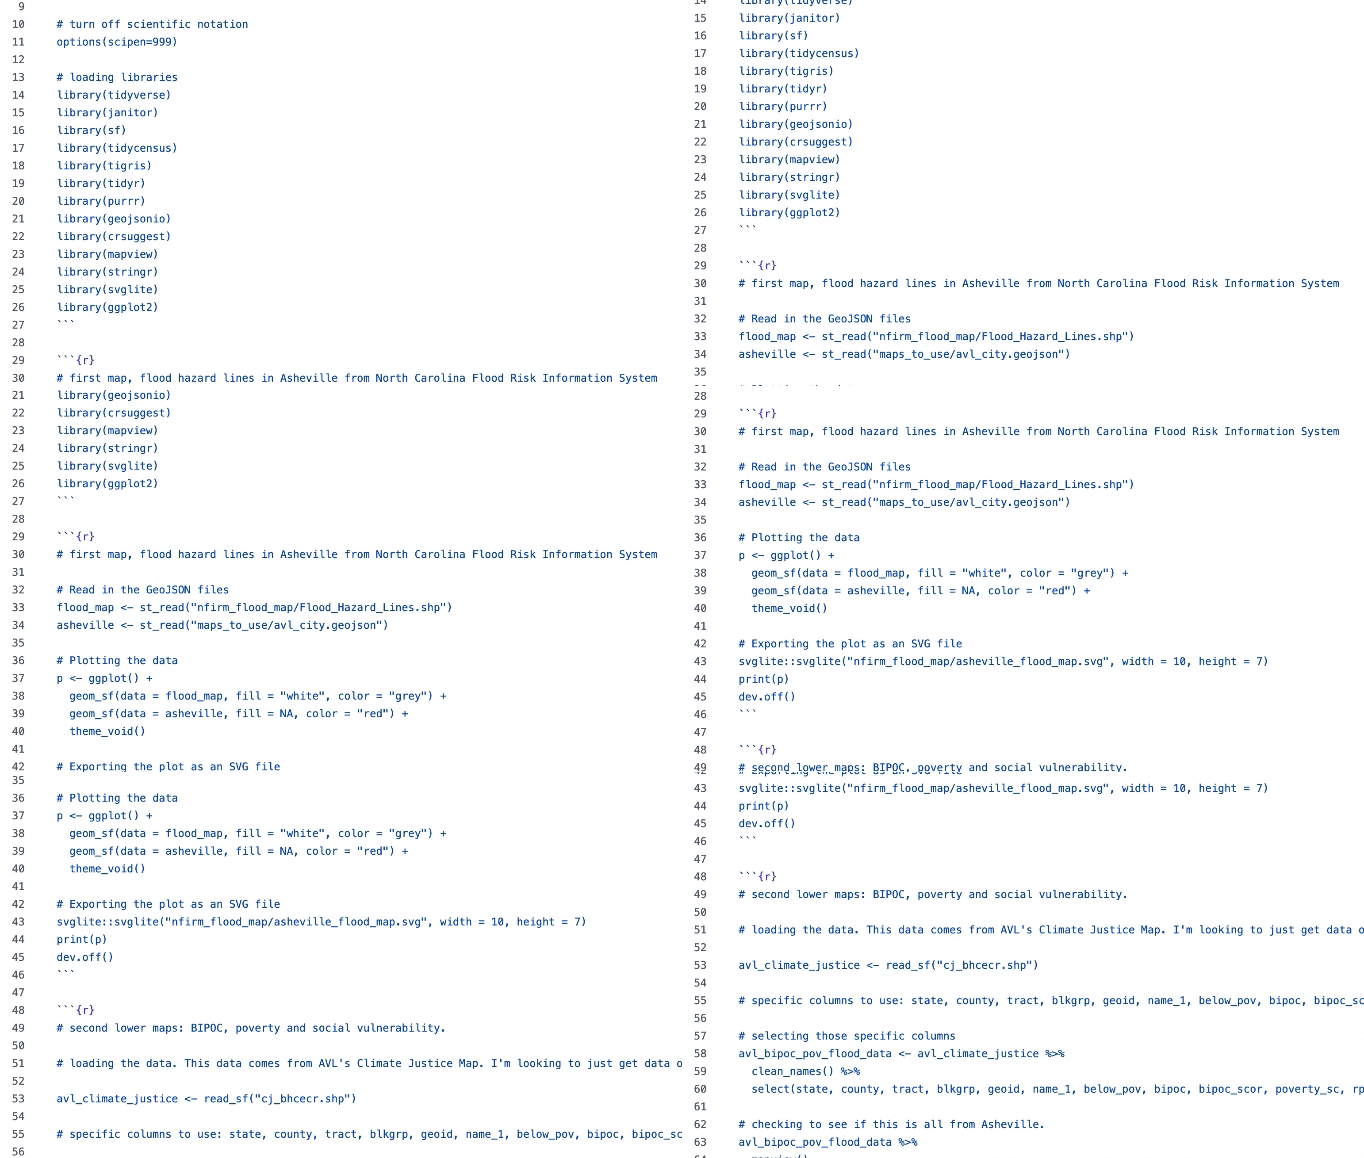


1/2
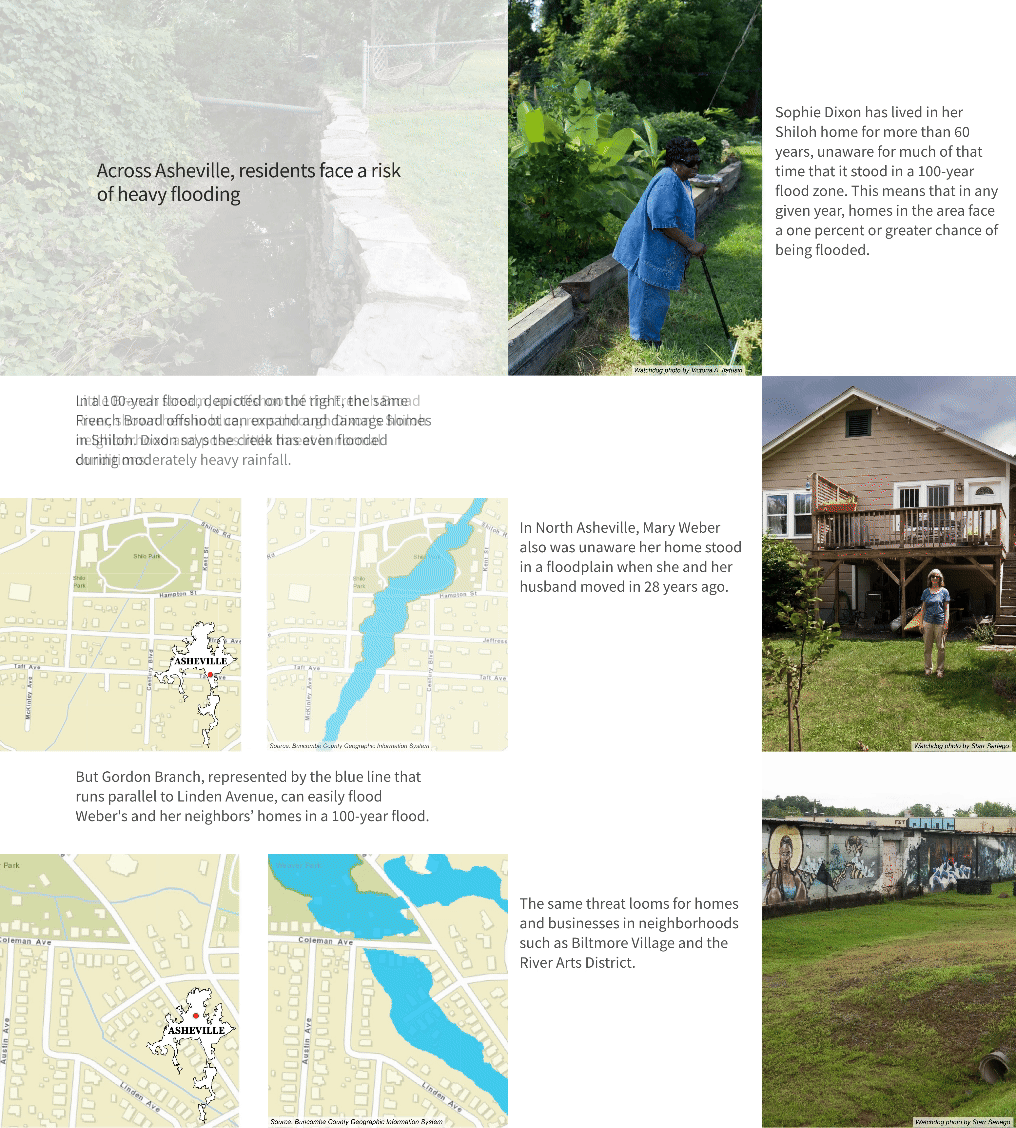
👩🏾🔧 R, Flourish, Illustrator
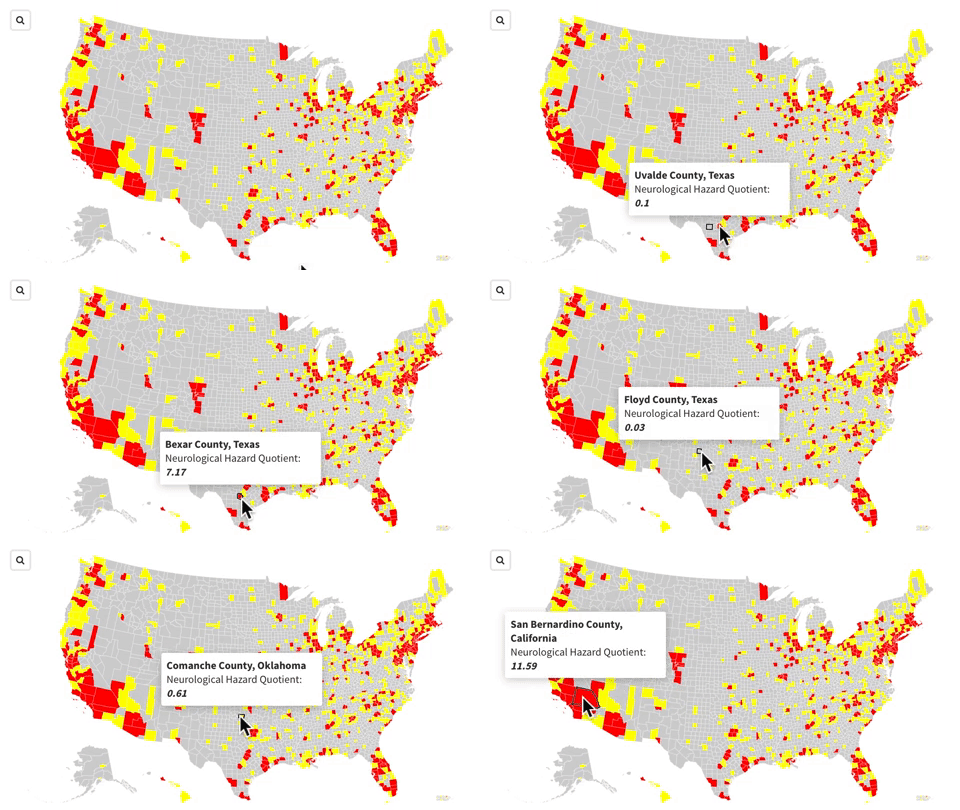
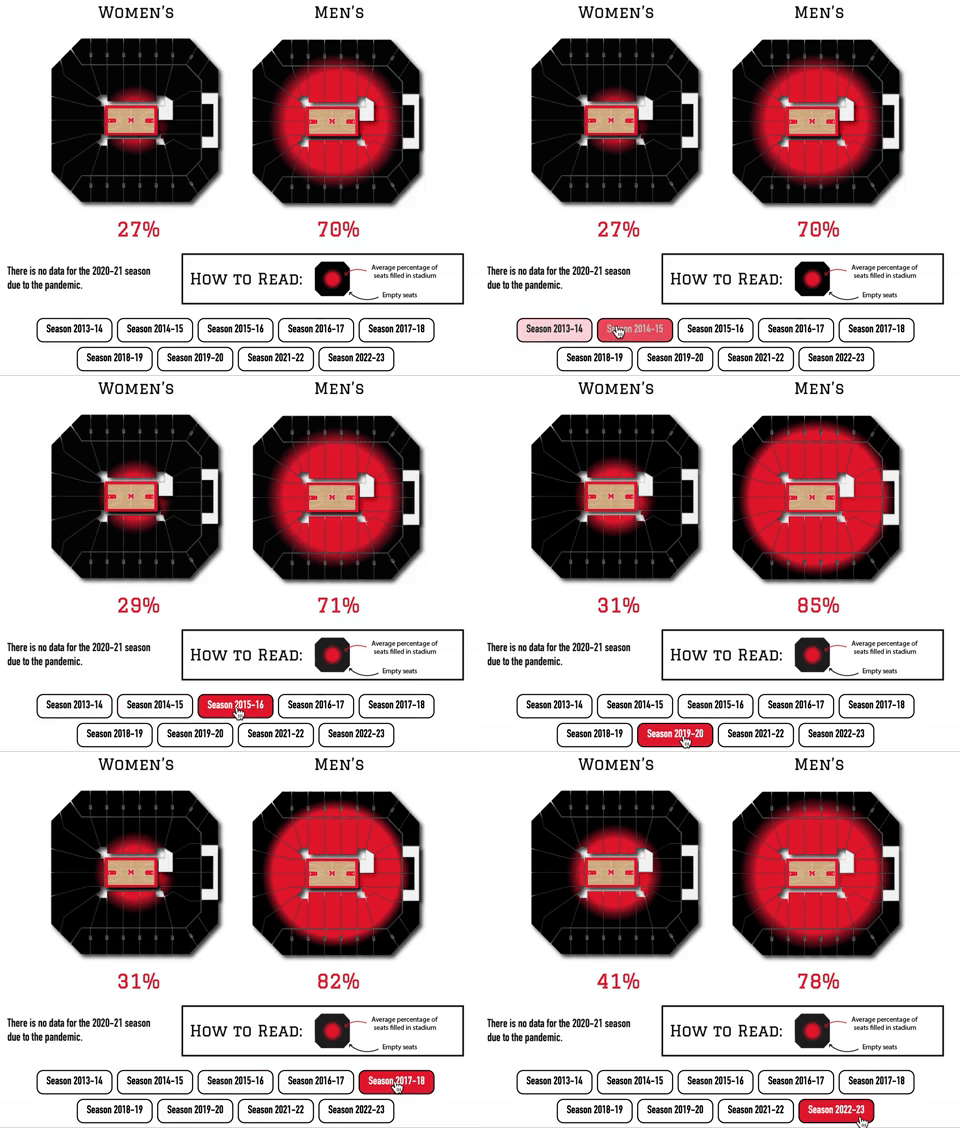
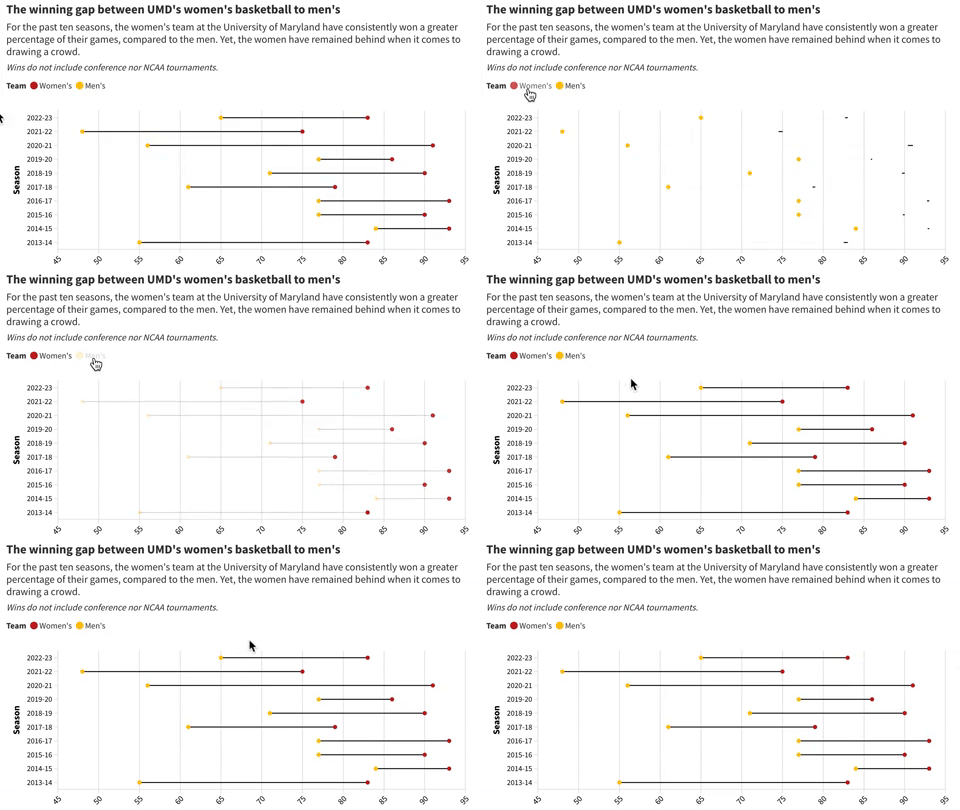
👩🏾🔧 Excel, Illustration, Flourish, jQuery


1/2
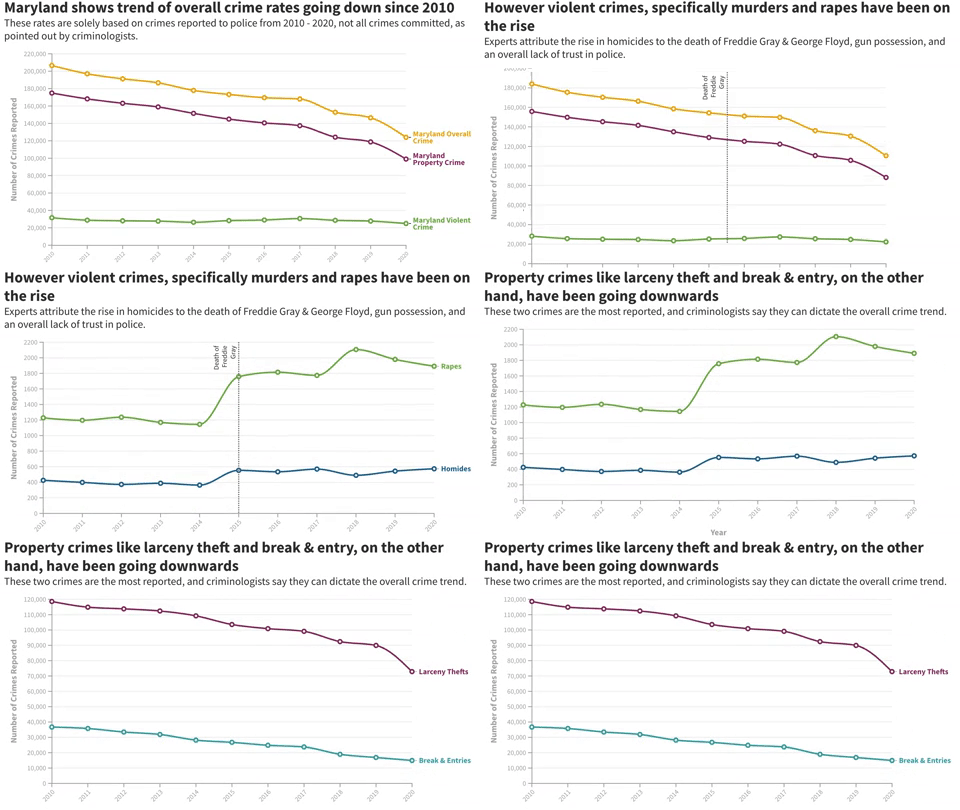
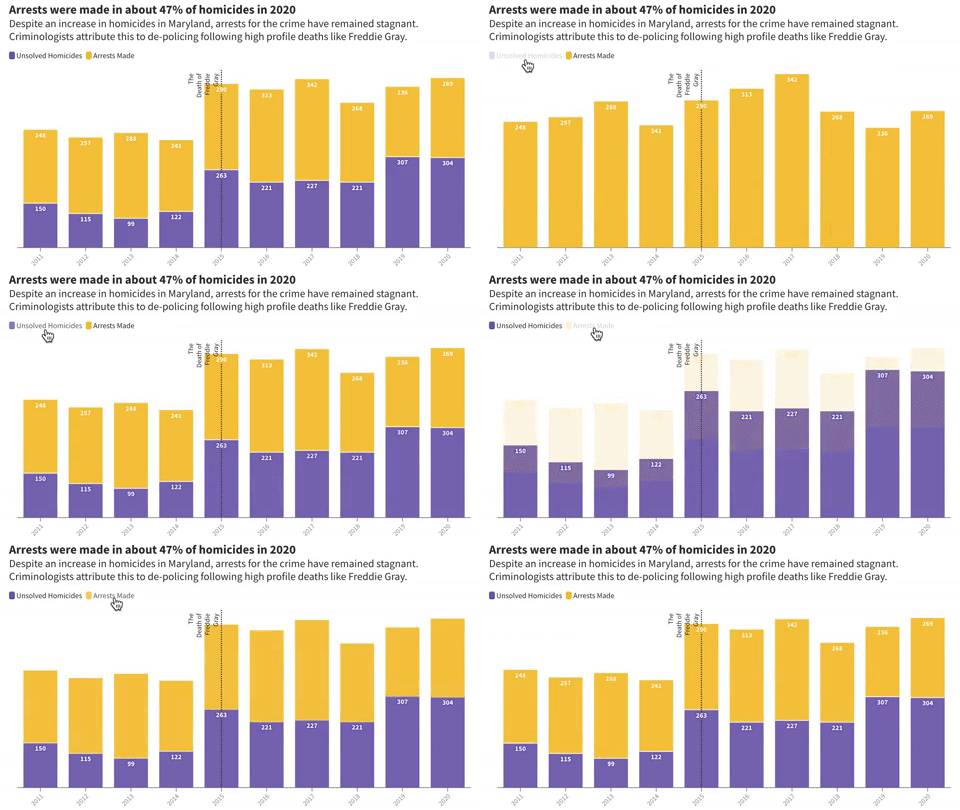
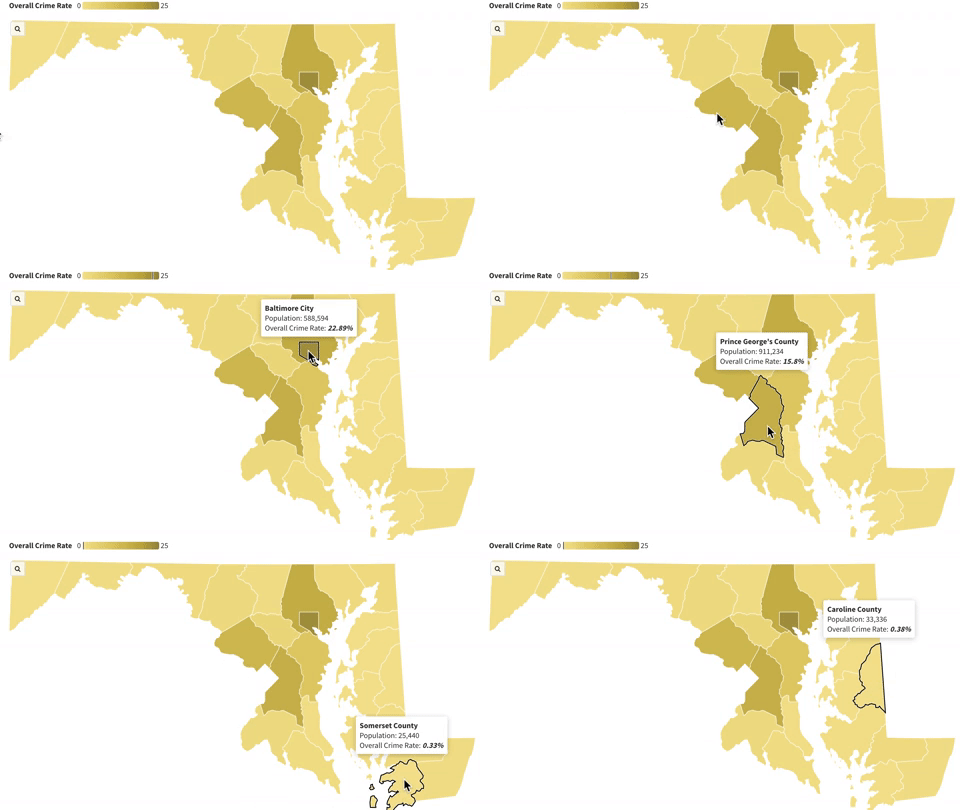
👩🏾🔧 Excel, Flourish
🔍 Sports Betting on College Campuses: Data Collection & Analysis for Howard Center for Investigative Journalism
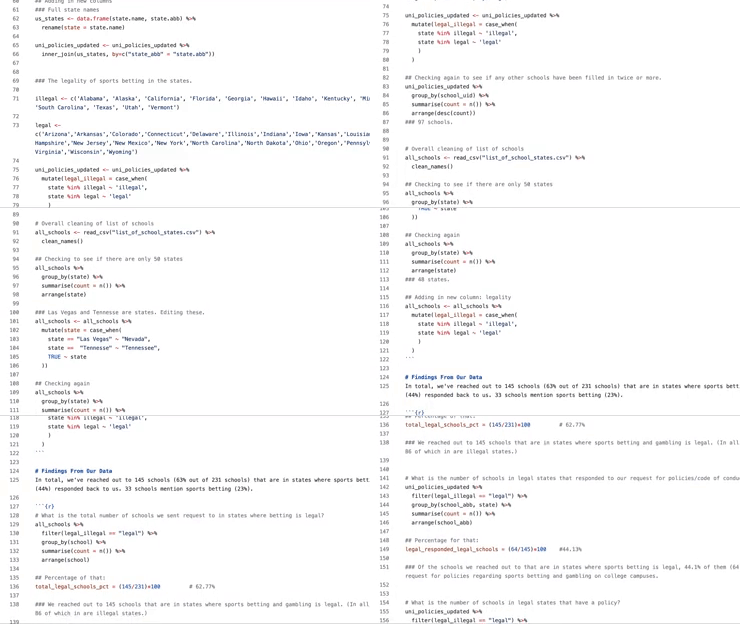
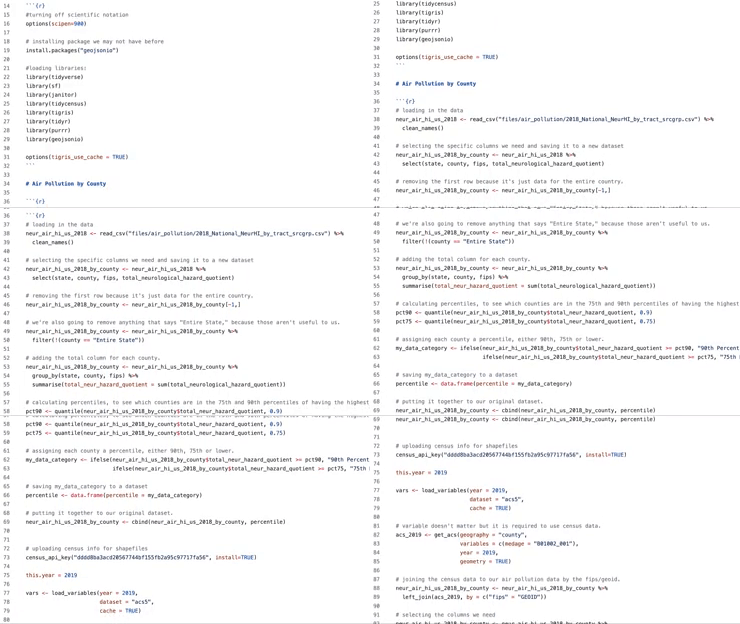
👩🏾🔧 R
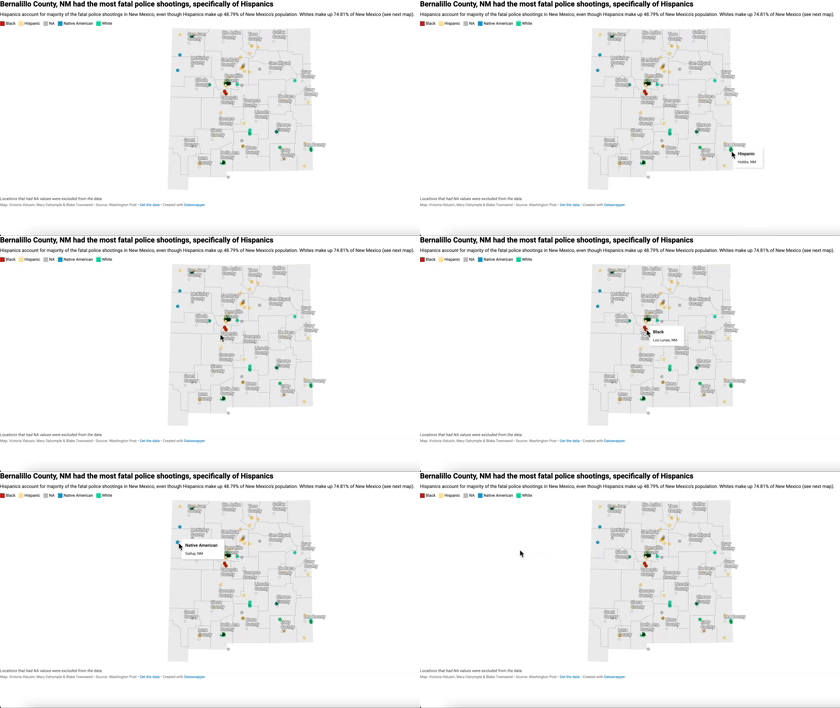
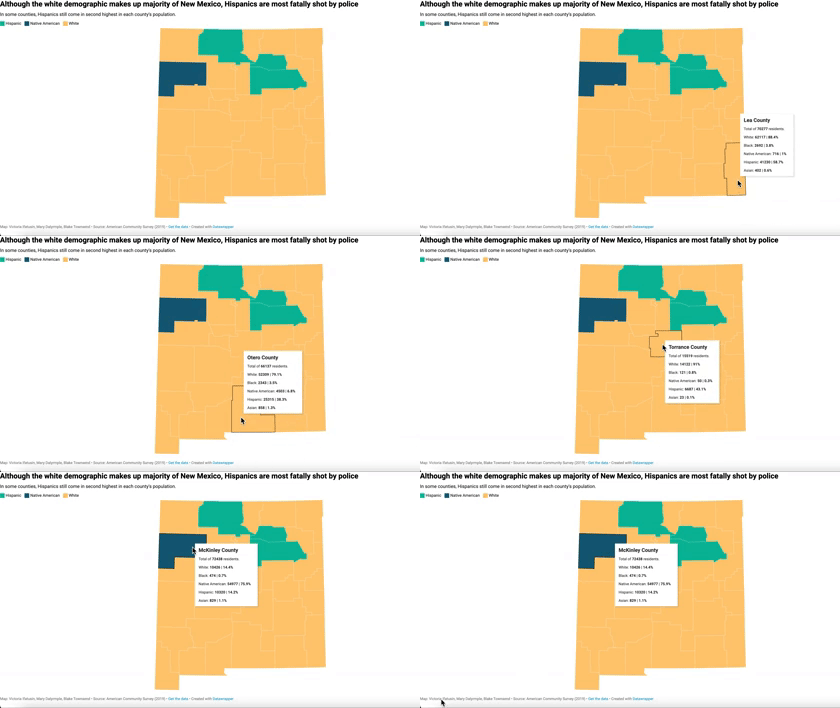
👩🏾🔧 R, Datawrapper 🔗
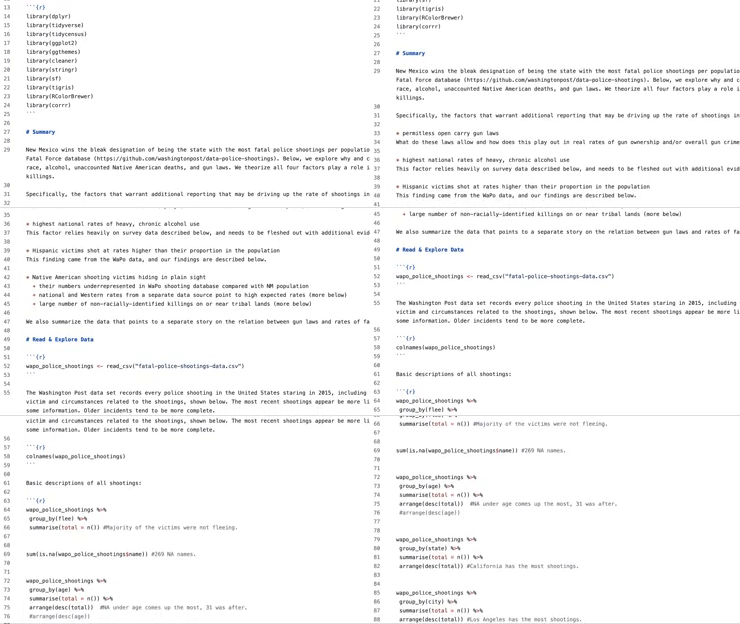
Analysis 🧐
bottom of page
